About
3D C. elegans Embryogenesis and Gene Expression
Melissa Chiasson, Timothy Durham, Andrew Hill, and Ning Li, UW Genome Sciences and Statistics
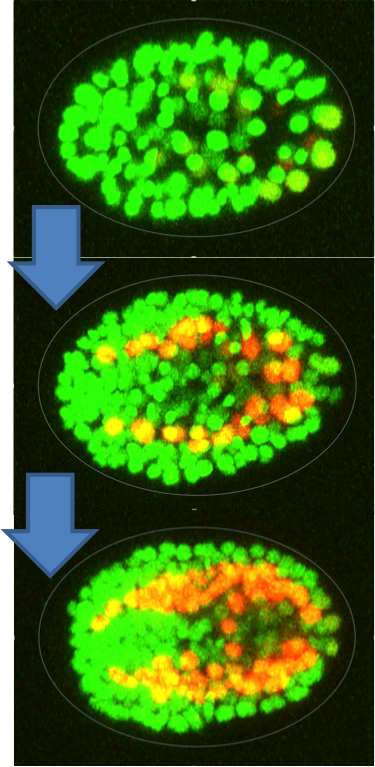
Caenorhabditis elegans (C. elegans) is a small roundworm used widely as a model organism in genetics and genomics. Its development has been well studied; each worm takes around 14 hours to grow from a single fertilized cell to a hatched larvae with 558 cells. Embryonic development proceeds due to the tightly choreographed expression of several genes. These patterns of gene expression contribute to cell identity. Location of cells during embryogenesis is also important, as cell-cell interactions can influence gene regulation.
The Expression Patterns In C. elegans (EPIC – http://epic2.gs.washington.edu/Epic2) project has generated a dataset that describes the spatial orientation of every cell during C. elegans embryogenesis, its developmental lineage and cell fate, and expression measurements for a set of about 227 genes. These data provide an expansive view of gene expression in the C. elegans embryo; however, to derive insights into gene expression patterns in different cells across time we need a tool to integrate and allow interactive exploration of the data.

We seek to address this lack of resource by developing an interactive visualization that includes a 3D plot of the C. elegans developing embryo, a lineage tree that is synched to the 3D plot, and plots of gene expression patterns. Users will be able to explore data using filters for lineage, cell type, and time point. In this way we hope to build a tool that C. elegans researchers can use to easily investigate patterns of gene expression during worm embryogenesis.

